Fractal Home
Liapunov diagrams interactive
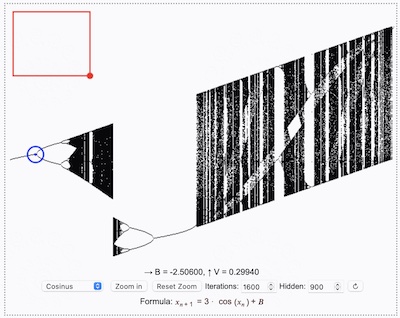
Here is a machine to calculate Liapunov diagrams for selected functions. The functions are the same as in the Feigenbaum partititon.
→ A = ?, ↑ B = ?
SequenceFormula: $x_(n+1) = 3*cos(x_n) + R$
Move the zoom rectangle, resize it with the red
point and click Zoom in. Wait for the image calculation.
Move the red circle to examine the values A, B.
The source code is liapunov.js. Thanks to Eric Rowell for the library KineticJS. Watch the HTML source code, too.
Understanding the Liapunov diagram

Read the Feigenbaum text first. The Feigenbaum diagram of the Cosinus iterator is shown here.
The Liapunov machine calculates the Liapunov exponents for the iterator function and shows the results in colors, forming the Liapunov diagram. The Liapunov exponent indicates the speed of variation in the value $x_n$ during the iteration, when the system parameter $R$ is changed. In regions of order the variation speed is low (red), it is fast in regions of chaos (blue).
Two values $A$ and $B$ are used for the system parameter $R$ during the iteration and calculation of the Liapunov exponent, following a given sequence (p.e. $ABBA$). This is done for the color calculation of every pixel of the image. You can examine the values $A, B$ in the machine by moving the red circle with dot in the middle.
