Fractal Home
Program Feigenbaum Diagrams
My program Feigenbaum for Windows® explores formulas in the described way and also allows time-diagrams, graphical iteration, phase diagrams in two or three dimensions and even Liapunov pictures. You can order the program for personal use only by email (please send me an aquivalent: ideas, pictures, programs, education-concepts, etc. with your mail).
More information: Watch the essays (written in German)

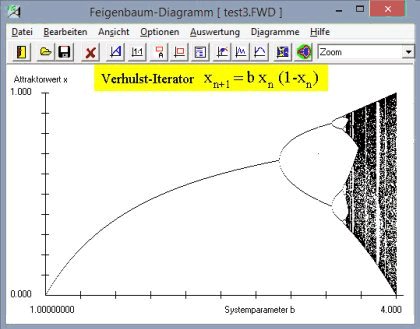
Screenshot Feigenbaum 4.3
Feigenbaum and Liapunov diagrams
Did you know that there is a connection between Feigenbaum and Liapunov diagrams? The iterator functions of Feigenbaum are suitable to get exciting Liapunov images. After drawing the Feigenbaum graph zoom into a chaos region and switch to the Liapunov module of my program. Please watch the screenshots above.
Mitchell Feigenbaum
The physicist Mitchell Feigenbaum (1944 - 2019) studied turbulences in liquids and developed the Logistic Map (Feigenbaum diagram), which shows a quantitative universality for a class of nonlinear transformations. The previous page informed you of this universal Feigenbaum Constant.

![Feigenbaum Diagram [Verhulst]](images/mfb2_1.jpg)
![Zoom-In 1 [Verhulst]](images/mfb2_2.jpg)
![Zoom-In 2 [Verhulst]](images/mfb2_3.jpg)
![Feigenbaum Diagram [Cosinus]](images/mfb3_1.jpg)
![Zoom-In with Liapunov Diagram [Cosinus]](images/mfb3_2.jpg)
![Zoom-In Liapunov Diagram [Cosinus]](images/mfb3_3.jpg)
![Graphical iteration after 1st bifurcation [Henon]](images/m_grafiter_bif2.jpg)
![Graphical iteration after 2nd bifurcation [Henon]](images/m_grafiter_bif4.jpg)
![Graphical iteration chaos region [Henon]](images/m_grafiter_chaos.jpg)
![Time diagram after 1st bifurcation [Henon]](images/m_timeiter_bif2.jpg)
![Time diagram after 2nd bifurcation [Henon]](images/m_timeiter_bif4.jpg)
![Time diagram chaos region [Sinus]](images/m_timeiter_chaos.jpg)